The post Why Use “Real-Time Digital Twins” for Streaming Analytics? appeared first on ScaleOut Software.
]]>
What Problems Does Streaming Analytics Solve?
To understand why we need real-time digital twins for streaming analytics, we first need to look at what problems are tackled by popular streaming platforms. Most if not all platforms focus on mining the data within an incoming message stream for patterns of interest. For example, consider a web-based ad-serving platform that selects ads for users and logs messages containing a timestamp, user ID, and ad ID every time an ad is displayed. A streaming analytics platform might count all the ads for each unique ad ID in the latest five-minute window and repeat this every minute to give a running indication of which ads are trending.
Based on technology from the Trill research project, the Microsoft Stream Analytics platform offers an elegant and powerful platform for implementing applications like this. It views the incoming stream of messages as a columnar database with the column representing a time-ordered history of messages. It then lets users create SQL-like queries with extensions for time-windowing to perform data selection and aggregation within a time window, and it does this at high speed to keep up with incoming data streams.
Other streaming analytic platforms, such as open-source Apache Storm, Flink, and Beam and commercial implementations such as Hazelcast Jet, let applications pass an incoming data stream through a pipeline (or directed graph) of processing steps to extract information of interest, aggregate it over time windows, and create alerts when specific conditions are met. For example, these execution pipelines could process a stock market feed to compute the average stock price for all equities over the previous hour and trigger an alert if an equity moves up or down by a certain percentage. Another application tracking telemetry from gas meters could likewise trigger an alert if any meter’s flow rate deviates from its expected value, which might indicate a leak.
What’s key about these stream-processing applications is that they focus on examining and aggregating properties of data communicated in the stream. Other than by observing data in the stream, they do not track the dynamic state of the data sources themselves, and they don’t make inferences about the behavior of the data sources, either individually or in aggregate. So, the streaming analytics platform for the ad server doesn’t know why each user was served certain ads, and the market-tracking application does not know why each equity either maintained its stock price or deviated materially from it. Without knowing the why, it’s much harder to take the most effective action when an interesting situation develops. That’s where real-time digital twins can help.
The Need for Real-Time Digital Twins
Real-time digital twins shift the application’s focus from the incoming data stream to the dynamically evolving state of the data sources. For each individual data source, they let the application incorporate dynamic information about that data source in the analysis of incoming messages, and the application can also update this state over time. The net effect is that the application can develop a significantly deeper understanding about the data source so that it can take effective action when needed. This cannot be achieved by just looking at data within the incoming message stream.
For example, the ad-serving application can use a real-time digital twin for each user to track shopping history and preferences, measure the effectiveness of ads, and guide ad selection. The stock market application can use a real-time digital twin for each company to track financial information, executive changes, and news releases that explain why its stock price starts moving and filter out trades that don’t fit desired criteria.
Also, because real-time digital twins maintain dynamic information about each data source, applications can aggregate this highly curated data instead of just aggregating data in the data stream. This gives users deeper insights into the overall state of all data sources and boosts “situational awareness” that is hard to maintain by just looking at the message stream.
An Example
Consider a trucking fleet that manages thousands of long-haul trucks on routes throughout the U.S. Each truck periodically sends telemetry messages about its location, speed, engine parameters, and cargo status (for example, trailer temperature) to a real-time monitoring application at a central location. With traditional streaming analytics, personnel can detect changes in these parameters, but they can’t assess their significance to take effective, individualized action for each truck. Is a truck stopped because it’s at a rest stop or because it has stalled? Is an out-of-spec engine parameter expected because the engine is scheduled for service or does it indicate that a new issue is emerging? Has the driver been on the road too long? Does the driver appear to be lost or entering a potentially hazardous area?
The use of real-time digital twins provides the context needed for the application to answer these questions as it analyzes incoming messages from each truck. For example, it can keep track of the truck’s route, schedule, cargo, mechanical and service history, and information about the driver. Using this information, it can alert drivers to impending problems, such as road blockages, delays or emerging mechanical issues. It can assist lost drivers, alert them to erratic driving or the need for rest stops, and help when changing conditions require route updates.
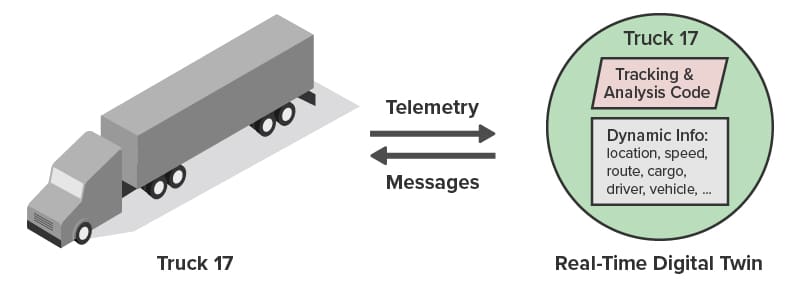
The following diagram shows a truck communicating with its associated real-time digital twin. (The parallelogram represents application code.) Because the twin holds unique contextual data for each truck, analysis code for incoming messages can provide highly focused feedback that goes well beyond what is possible with traditional streaming analytics:
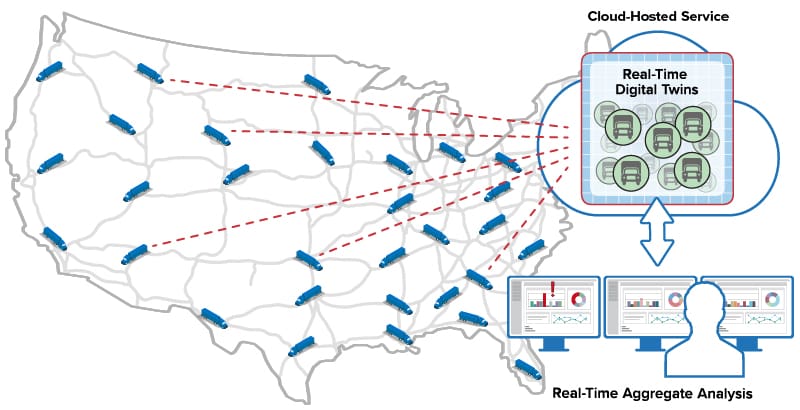
As illustrated below, the ScaleOut Digital Twin Streaming Service runs as a cloud-hosted service in the Microsoft Azure cloud to provide streaming analytics using real-time digital twins. It can exchange messages with thousands of trucks across the U.S., maintain a real-time digital twin for each truck, and direct messages from that truck to its corresponding twin. It simplifies application code, which only needs to process messages from a given truck and has immediate access to dynamic, contextual information that enhances the analysis. The result is better feedback to drivers and enhanced overall situational awareness for the fleet.
Lower Complexity and Higher Performance
While the functionality implemented by real-time digital twins can be replicated with ad hoc solutions that combine application servers, databases, offline analytics, and visualization, they would require vastly more code, a diverse combination of skill sets, and longer development cycles. They also would encounter performance bottlenecks that require careful analysis to measure and resolve. The real-time digital twin model running on ScaleOut Software’s integrated execution platform sidesteps these obstacles.
Scaling performance to maintain high throughput creates an interesting challenge for traditional streaming analytics platforms because the work performed by their task pipelines does not naturally map to a set of processing cores within multiple servers. Each pipeline stage must be accelerated with parallel execution, and some stages require longer processing time than others, creating bottlenecks in the pipeline.
In contrast, real-time digital twins naturally create a uniformly large set of tasks that can be evenly distributed across servers. To minimize network overhead, this mapping follows the distribution of in-memory objects within ScaleOut’s in-memory data grid, which holds the state information for each twin. This enables the processing of real-time digital twins to scale transparently without adding complexity to either applications or the platform.
Summing Up
Why use real-time digital twins? They solve an important challenge for streaming analytics that is not addressed by other, “pipeline-oriented” platforms, namely, to simultaneously track the state of thousands of data sources. They use contextual information unique to each data source to help interpret incoming messages, analyze their importance, and generate feedback and alerts tailored to that data source.
Traditional streaming analytics finds patterns and trends in the data stream. Real-time digital twins identify and react to important state changes in the data sources themselves. As a result, applications can achieve better situational awareness than previously possible. This new way of implementing streaming analytics can be used in a wide range of applications. We invite you to take a closer look.
The post Why Use “Real-Time Digital Twins” for Streaming Analytics? appeared first on ScaleOut Software.
]]>The post The Digital Twin: A Foundational Concept for Stateful Stream Processing appeared first on ScaleOut Software.
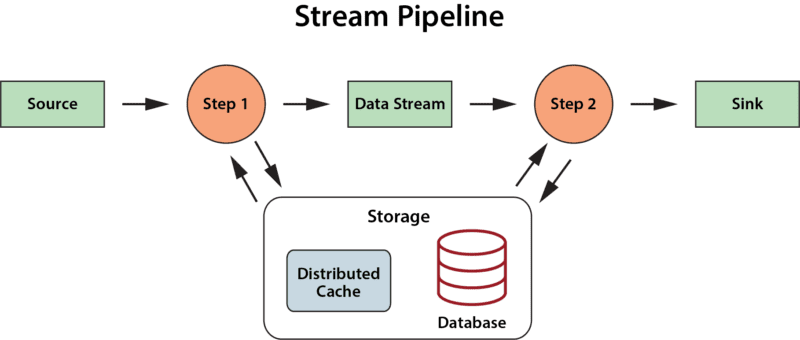
]]>The following diagram depicts a typical stream processing pipeline processing events from many data sources:

More recent stream-processing platforms, such as Apache Flink, have incorporated stateful stream processing into their architectures in the form of key-value stores or databases that the application can make use of to enhance its analysis. But they do not offer a specific semantic model which applications can leverage to organize and track useful state information and thereby deepen their ability to analyze data streams.
The answer to this challenge may be found in the digital twin model. While this term was coined by Dr. Michael Grieves (U. Michigan) in 2002 for use in product life cycle management, it was recently popularized for IoT by Gartner in a 2017 report. This model offers key insights into how state data can be organized within stream-processing applications for maximum effectiveness. In particular, it suggests that applications implement a stateful model of the physical data sources that generate event streams, and that the application maintain separate state information for each data source. For example, using the digital twin model, a rental car company can track and analyze telemetry from each car in its fleet with digital twins:

The digital twin model thereby provides an intuitive approach to organizing state data, and, by shifting the focus of analysis from the event stream to the data sources, it potentially enables much deeper introspection than previously possible. With the digital twin model, an application can conveniently track all relevant information about the evolving state of physical data sources. It can then analyze incoming events in this rich context to provide high quality insights, alerting, and feedback. For example, digital twins of medical freezers could track detailed facts about the specific model, its service history, environmental conditions, and usage patterns for each physical unit to help analyze telemetry from a temperature sensor and make more informed predictions about possible impending failures.
Beyond providing a powerful semantic model for stateful stream processing, digital twins also offer advantages for software engineering because they can take advantage of well understood object-oriented programming techniques. A digital twin can be implemented as a data class which encapsulates both state data (including a time-ordered event collection) and methods for updating and analyzing that data. Analytics methods can range from simple sequential code to machine learning algorithms or rules engines. These methods also can reach out to databases to access and update historical data sets.
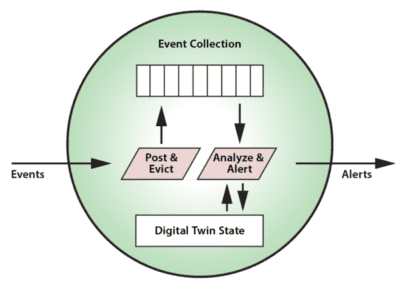
For each physical data source, an instance of a digital twin model is created by the stream-processing system to receive and analyze events. It is the responsibility of the system to correlate data from a given data source for delivery to each instance of a physical twin. In many applications, a stream-processing system may host thousands (or more) digital twins to handle the workload from its data sources. In an upcoming blog, we will look at how in-memory data grids provide a highly scalable platform for hosting digital twins.
One parting thought concerns the granularity of a digital twin. Does it encompass a model of a single sensor or that of a subsystem comprising multiple sensors? As with object-oriented programming in general, the answer is in the hands of the application developer, who must make choices about which data (and event streams) are logically related and need to be encapsulated in a single entity for analysis to meet the application’s goals.
The digital twin model provides a powerful organizational tool that focuses on the state of data sources instead of just the data within event streams. With this additional context, it magnifies the developer’s ability to implement deep introspection and represents a new way of thinking about stateful stream processing.
The post The Digital Twin: A Foundational Concept for Stateful Stream Processing appeared first on ScaleOut Software.
]]>The post Using In-Memory Data Grids for ETL on Streaming Data appeared first on ScaleOut Software.
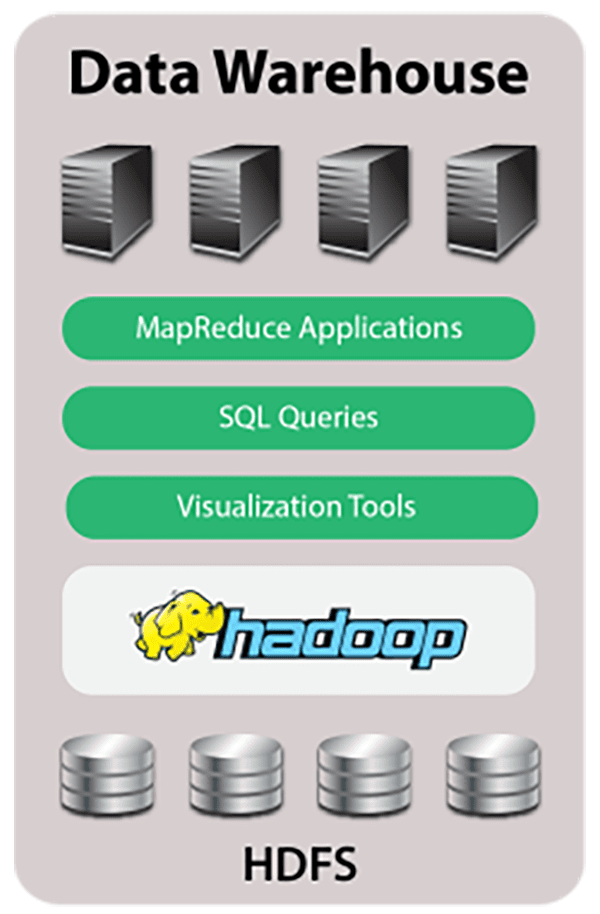
]]>
Using ETL to Feed the Data Warehouse
A key challenge for any data warehouse is to supply data to it in a format that can be readily ingested and analyzed, and this is the role of the well-known process called “extract-transform-load” (ETL). In the case of Hadoop, this usually means extracting data from external sources and transforming them into a form that can be stored in HDFS for use by MapReduce applications. When incoming data arrives as collections of files, it’s a straightforward matter either to just copy them into HDFS or to periodically run a batch MapReduce application which reads in the files, transforms the data as needed, and outputs it to HDFS.
Consider a company that sends end-of-day reports from its field offices to the data warehouse for aggregate analysis. The data warehouse can start up a MapReduce application after the last report has been uploaded to read from an external file system, reorganize it, and then output the results to HDFS. For example, this application might use the keys output from the mappers to join data for various fields (such as, revenue, volume, etc.) across all offices so that the reducers can output this data to HDFS by field instead of by office.
Implementing ETL using MapReduce offers several advantages. It makes use of the data warehouse’s parallel infrastructure to quickly process the data on a cluster of servers. It also leverages the development team’s skill sets in developing MapReduce applications to minimize overall cost. Lastly, it avoids the need to deploy a variety of technologies, which creates unnecessary complexity and headaches for system administrators.
The Challenge: Real-Time ETL
Running ETL using a batch MapReduce job works fine for static data, such as file-based, end-of-day reports. But what about streaming data that continuously flows into the data warehouse? For example, consider an e-commerce website that accepts orders which flow to the data warehouse for analysis to identify patterns and issues. The website generates a continuous stream of orders which must be stored as HDFS files by an ETL processing step, as illustrated by the following diagram:

The simplest possible approach to this problem is to store the incoming orders as individual files in HDFS. Of course, this does not allow for any data translation prior to saving the files in the data warehouse. Also, this creates many file I/O operations both when loading HDFS and later when reading large numbers of small files during each analysis.
A better solution would be to run a MapReduce application that reads the input stream and outputs to HDFS. This enables the translation step to reorganize and consolidate the data as necessary and to efficiently output it to HDFS. By using standard MapReduce instead of another stream processing platform, such as Spark or Storm, the skill sets already employed for the data warehouse can be used instead of requiring a different software stack to perform ETL.
However, the data warehouse’s batch-oriented MapReduce execution environment incurs high scheduling latency (typically 15 seconds or longer) that makes it unsuitable for processing an incoming data stream. Furthermore, this MapReduce application would need to run continuously, tying up resources that were intended for data analysis, not ongoing ETL.
The Solution: Offload to an In-Memory Data Grid Running MapReduce
The streaming ETL challenge can be met by deploying an in-memory data grid with an integrated MapReduce engine, such as ScaleOut hServer, to capture the data stream in real time, perform ETL, and offload the data warehouse. Let’s take a look at how this works.
IMDGs host data in memory and distribute it across a cluster of commodity servers. Using an object-oriented data storage model, they provide APIs for storing, accessing, and updating data objects in well under a millisecond (depending on the size of the object). This enables operational systems to use IMDGs for storing fast-changing, “live” data, such as the data warehouse’s incoming order stream.
An IMDG provides an ideal repository for the data stream, buffering orders as objects within the grid and running the ETL application using built-in MapReduce (more on that below). The IMDG matches the arrival rate of the incoming data stream by adding servers as needed to its cluster, ensuring that both storage capacity and update throughput scale linearly while keeping update times fast. Also, the IMDG maintains high availability using data replication so that if a server fails, the IMDG can continue to handle update requests without delay.
Because IMDGs store data in memory distributed across a cluster of servers, they can easily perform data-parallel computations on stored data, such as the ETL function needed by the data warehouse; they simply make use of the cluster’s processing power to analyze data “in place,” that is, without the need to migrate it to other servers. This enables IMDGs to complete ETL fast (possibly in less than a second) with minimal overhead.
Some IMDGs, such as ScaleOut hServer, can execute standard Hadoop MapReduce applications (i.e., applications which are fully code-compatible with Apache Hadoop), allowing these applications to access in-memory data from the grid and output to HDFS. This enables the ETL function to be deployed as a conventional MapReduce application within the IMDG. The application extracts orders from the grid’s memory, transforms them as required for storage in the data warehouse, and then outputs them to HDFS using standard MapReduce techniques, as illustrated in the following diagram:
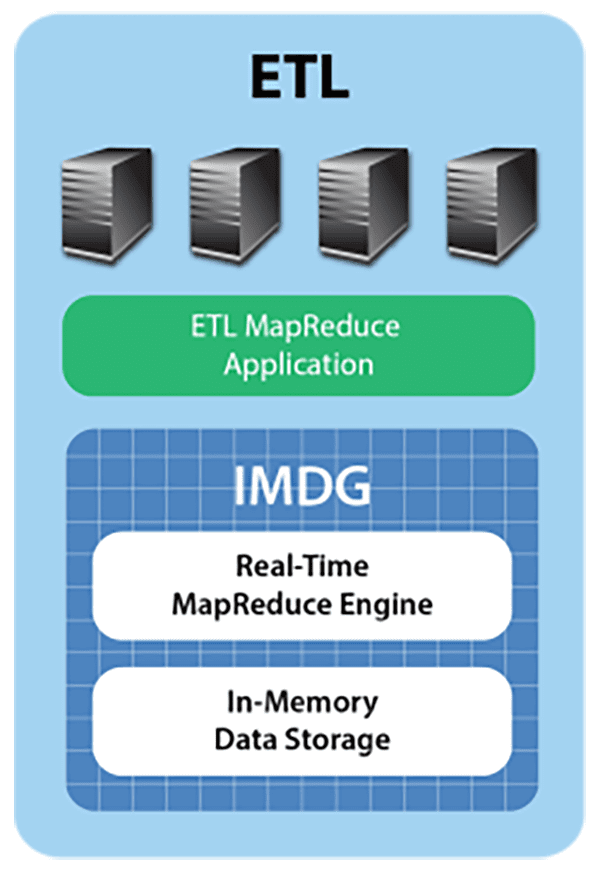
Ensuring Continuous Processing
The use of an IMDG offloads the data warehouse, allowing the MapReduce application performing ETL to run continuously. It also dramatically reduces the latency required to start up each iteration from 15+ seconds to a few milliseconds. Buffering orders in memory while simultaneously migrating them to HDFS ensures that ETL processing seamlessly keeps up with the incoming data stream.
To show how continuous processing can be achieved, the following diagram depicts the use of a “double buffering” strategy to perform ETL processing. IMDGs organize collections of objects within name spaces that can be identified and used as input to a MapReduce application. In this case, while incoming orders are added to one name space, which serves as an input buffer, the MapReduce application extracts orders from a second name space that was previously filled; it then organizes them into an appropriate format and outputs the data to HDFS. Upon completion, the extracted orders are cleared from the associated name space, the name spaces are switched, and the MapReduce application is restarted on the other name space:
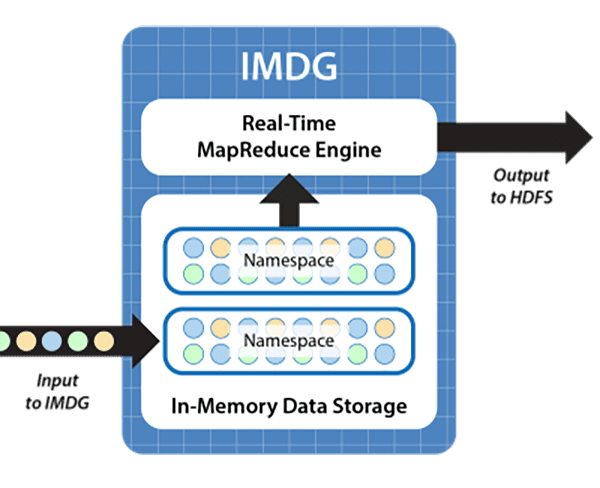
This technique uses the memory of the IMDG to allow orders to flow smoothly into the IMDG while processing by the MapReduce ETL application is ongoing. It requires that sufficient memory be available in the IMDG to buffer incoming order objects during the processing time of the application. Because the IMDG can scale memory capacity by adding servers and because the IMDG fast start-up and data-parallel execution minimize the ETL application’s processing time, continuous processing of incoming orders is ensured.
Summing Up
Hadoop’s powerful analytics capabilities are rapidly making it the centerpiece of next-generation data warehouses. The ability of IMDGs to implement ETL for streaming data enables them to serve as a vital component of these infrastructures. IMDGs which can run MapReduce applications provide the threefold benefits of meeting the low latency requirements for ingesting streaming data, offloading the data warehouse’s execution environment, and leveraging existing Hadoop skills. ETL on streaming data is yet another example of real-time analytics and a prime application for IMDGs.
Perhaps most exciting is that hosting ETL in an IMDG’s real-time analytics engine opens the door to analyzing the order stream (or a clickstream) in real time and generating instant feedback for web users. Over time, the ETL function can evolve to perform real-time analysis, provide guidance, and thereby drive incremental sales. The IMDG’s analytics engine forms a bridge from the data warehouse to customers, helping push the benefits of data analytics to the point of sale where it can have maximum impact.
The post Using In-Memory Data Grids for ETL on Streaming Data appeared first on ScaleOut Software.
]]>The post How Do In-Memory Data Grids Differ from Storm? appeared first on ScaleOut Software.
]]>Quick Review: IMDGs Provide Fast Data Storage
(The following description of in-memory data grids (IMDGs) is excerpted from last week’s blog post; see that post for more details.)
IMDGs host data in memory and distribute it across a cluster of commodity servers. Using an object-oriented data storage model, they provide APIs for updating data objects typically in well under a millisecond (depending on the size of the object). This enables operational systems to use IMDGs for storing, accessing, and updating fast-changing, “live” data, while maintaining fast access times even as the storage workload grows.
Data storage needs can easily grow as more users store data within an IMDG. IMDGs accommodate this growth by adding servers to the cluster and automatically rebalancing stored data across the servers. This ensures that both capacity and throughput scale linearly with growth in the workload, and access and update times remain low regardless of the workload’s size. Moreover, IMDGs maintain stored data with high availability using data replication so that if a server fails, operational systems can continuously handle access requests and update requests without delay.
IMDGs Perform Data-Parallel Computation
Because IMDGs store data in memory distributed across a cluster of servers, they easily can perform data-parallel computations on stored data; they simply make use of the cluster’s processing power to analyze data “in place,” that is, without the need to migrate it to other servers. This enables IMDGs to provide fast results (often in milliseconds) with minimal overhead.
The following diagram of the architecture used by ScaleOut Analytics Server and ScaleOut hServer shows a stream of incoming changes which are applied to the grid’s memory-based data store using API updates. The real-time analytics engine performs data parallel computation on stored data, combines the results across the cluster, and outputs a combined stream of alerts to the operational system.
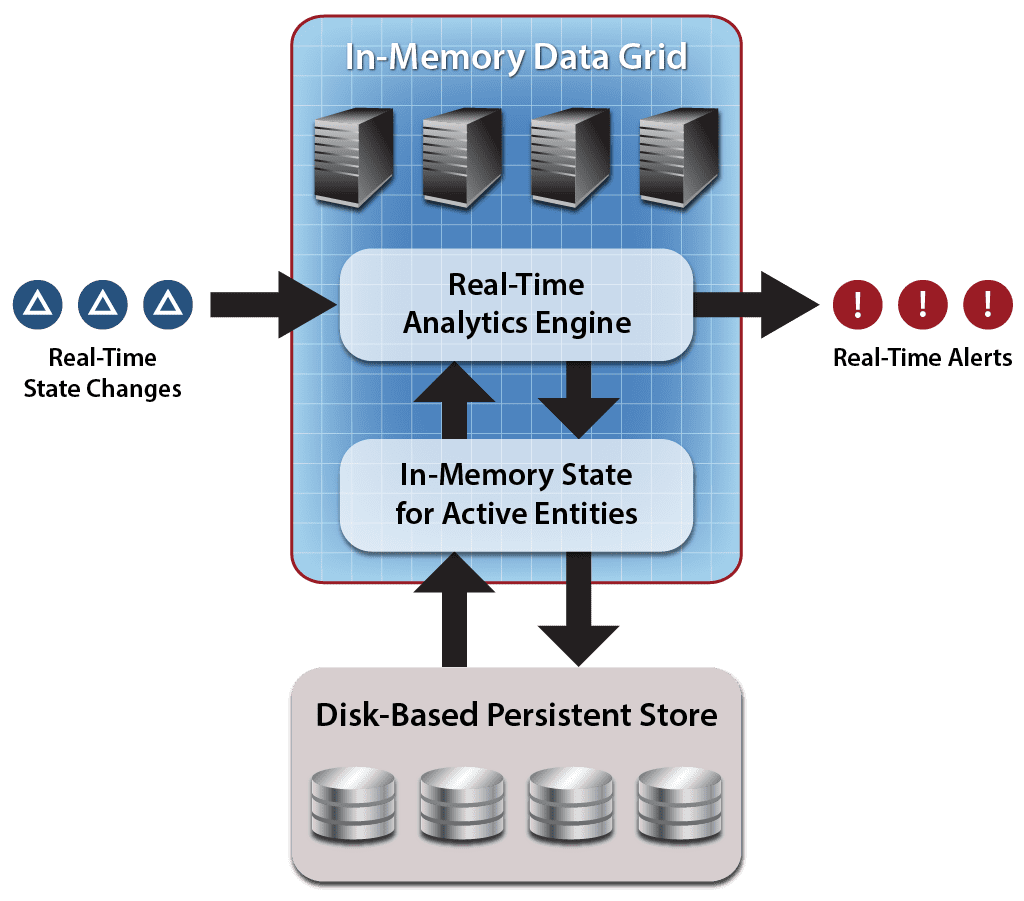
A significant aspect of the IMDG’s architecture for data analytics is that it performs computations on data hosted in memory – not specifically on an incoming data stream. This memory-based storage is continuously updated by an incoming data stream, so the computation has access to the latest changes to the data. However, the computation also has access to the history of changes manifested by the current state of data stored in the grid. This gives the computation a rich data set for analysis that includes both the incoming data stream and the application’s persistent state.
What is Storm?
Storm originally was developed by Nathan Marz at Backtype to overcome the limitations of Hadoop in analyzing streams of incoming data, such as Twitter streams and web log files. Its goal was to provide real-time, continuous computation that is both scalable and fault tolerant. Described both as stream processing and event processing, its computation model incorporates a combination of task parallelism and pipelining. The developer describes two basic entities: “spouts,” which generate streams of data in the form of ordered tuples, and “bolts,” which process incoming streams and optionally generate outgoing streams for other bolts. Spouts and bolts are organized into an acyclic, directed graph to create an executable configuration. (See this slide deck, among many available, for a more detailed explanation.)
The following diagram illustrates a Storm configuration of streams and bolts processing a set of input streams and generating a set of output streams. The green circles represent tuples within an input stream, and the blue boxes represent bolts. Note that spouts which generate the input streams are not shown in the diagram. The orange circles represent an optional output data stream, which may be implemented by the bolts in an arbitrary manner (e.g., as API calls to an external agent instead of as a stream of tuples).
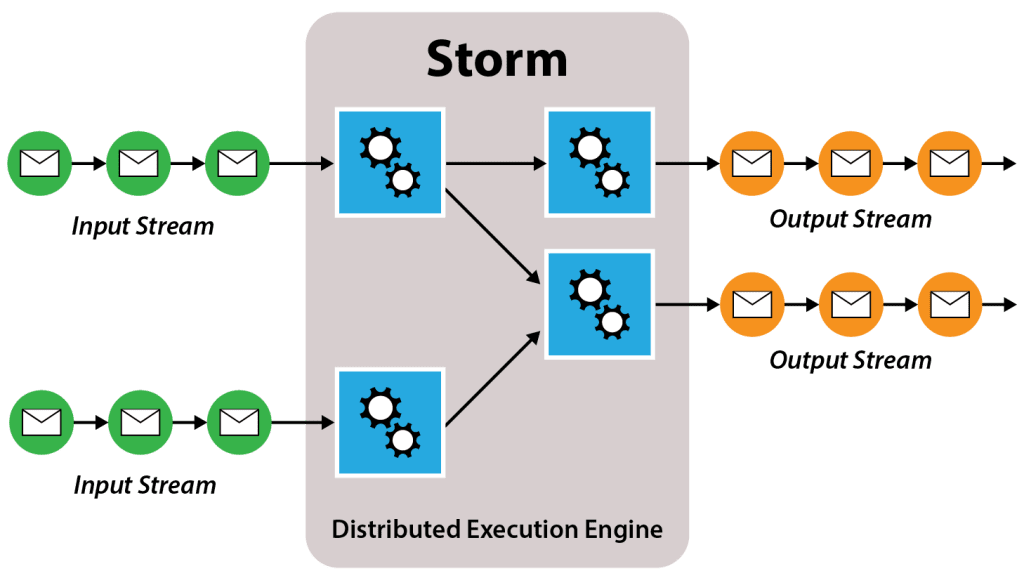
Application developers specify several aspects of the configuration, such as the number of tasks that can be spawned to execute each bolt, and the manner in which an incoming stream’s tuples are distributed across these tasks. Various groupings implement characteristics that correspond to behaviors found in Hadoop MapReduce. For example, the shuffle grouping implements a random distribution of tuples to tasks akin to input to mappers, and the field grouping implements a key-based partitioning very close to that used as input to reducers. Other groupings also are available, such as “all,” which is equivalent to multicast.
Storm implements and executes a specified configuration using a hierarchy of nodes whose state and fault-tolerance are maintained by the open-source Zookeeper cluster manager. A master node (called Nimbus) manages a set of worker nodes (called Supervisors), which run tasks. Strategies are available to handle failures of each of these components and to ensure that stream tuples are reliably processed.
Comparison of IMDGs to Storm: Providing Continuous Execution
A major strength of Storm is its continuous execution model. Once a configuration has been deployed, incoming data streams can be processed without scheduling delays, thereby providing uninterrupted, real-time results. This overcomes a major drawback of Hadoop MapReduce, which processes data in batch jobs with significant latency (often 15+ seconds) in starting up each job.
IMDGs approximate Storm’s continuous execution model in two ways. First they allow continuous, overlapped updates to in-memory state, enabling them to handle high arrival rates of incoming data (e.g., 1000s of updates per second for each IMDG server in a cluster). Both IMDGs and Storm scale out to increase throughput. Second, some IMDGs allow data-parallel operations to be performed continuously with very low startup delay (typically a few milliseconds). This allows IMDGs to output a stream of analysis results that matches the low latency required by operational systems. (Unlike Storm, IMDGs such as ScaleOut hServer also precisely match Hadoop’s MapReduce semantics, which require that reducers be able to process all key-value pairs emitted by the mappers in a given computation.)
Stateless versus Stateful Data Model
Storm’s data model describes a set of tuple streams. Bolts analyze and filter these streams, creating new streams to hold their results. While bolts are unconstrained in their ability to access and update external stores, such as IMDGs or file-based NoSQL stores (e.g., Mongo DB or Cassandra), this is not a central aspect of their processing model. Put another way, Storm does not provide any particular semantics for managing stateful data.
In contrast, IMDGs are organized around a stateful data model implemented by an object-oriented, in-memory store which is both scalable and highly available. This store is intended to hold ongoing, business-logic state implemented by collections of objects representing fast-changing data used in operational environments. In previous blog posts, we have seen examples in e-commerce (e.g., session-state and shopping carts) and financial services (e.g., portfolios and stock histories). Incoming data streams update these entities, which hold information that persists and evolves over their lifetimes. Making these entities “first class” citizens in the computation model simplifies the design of business logic while enabling stream processing using a combination of object-oriented updates and data-parallel computation to both modify and analyze this state.
Complexity of the Computation Model
Where IMDGs and Storm really differ is in their approaches to managing the complexity of the computation model. Like Microsoft Dryad and other parallel execution platforms with task precedence graphs, Storm defines a computation using a directed graph of execution nodes, each of which has a variable number of tasks. While the modular nature of an execution pipeline has appeal, its complexity can quickly become daunting. One reason for this is that the configuration’s graph is represented by sequential code describing bolts and the streams to which they are connected. As the number of bolts and streams grows, it becomes increasingly difficult to visualize their relationships and grasp the application’s overall behavior.
Other parallel systems like Storm with task precedence graphs, such as messaging passing systems and actor models, have demonstrated substantial complexity over the last few decades. Also, the Storm application developer must specify the number of tasks executed by each bolt. As the number of bolts and streams increase, it becomes challenging for the developer to manage the graph, predict the dynamics of its execution, and tune for best performance.
A central reason that IMDGs employ a data-parallel computation model is its simplicity, both in exposition and execution. (Another key reason is that data-parallel computation minimizes data motion which limits scalability. Storm’s data motion between bolts may incur more network overhead than IMDGs and impact scalability, but we have not evaluated this.) Since their application code is inherently straightforward, data-parallel programs are relatively easy to understand, and they don’t need extensive tuning for high performance. Also, separating updates to business logic state from data-parallel analytics simplifies integration into operational systems.
Summing Up
IMDGs offer a platform for scalable, memory-based storage and data-parallel computation which was specifically designed for use in operational systems. Because it incorporates API support for accessing and updating individual data objects and data-parallel analytics, IMDGs are easily integrated into the business logic of these systems.
Storm was designed for a different purpose, namely to analyze streams of data using a continuously running execution pipeline. Its more complex computation model fits this purpose well, and, as a result, Storm embodies a different set of tradeoffs than IMDGs. Clearly, the term “real-time analytics” encompasses a variety of solutions designed to meet diverse business requirements.
The post How Do In-Memory Data Grids Differ from Storm? appeared first on ScaleOut Software.
]]>